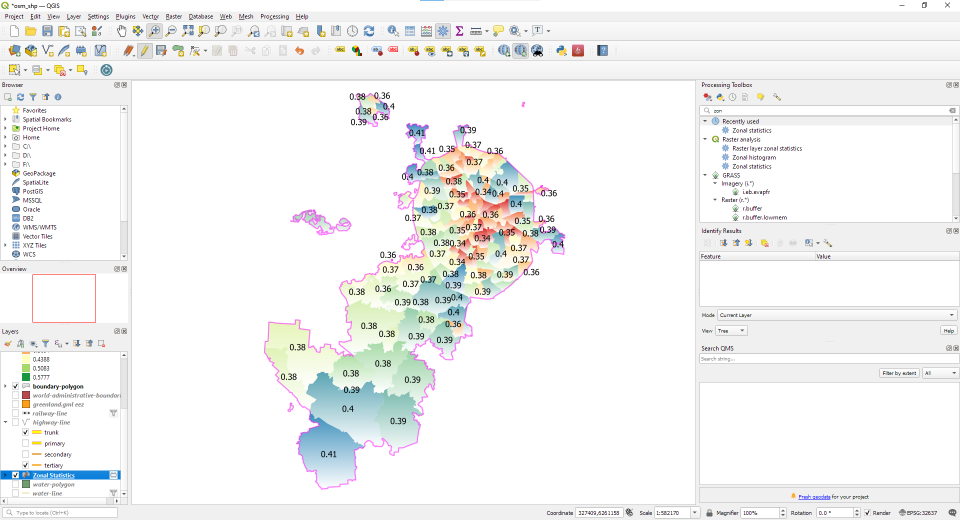
The “Greenness” of Moscow

According to many studies, people are ready to pay more for leaving in a greener area. However, how to estimate the greenness of an area? Earth remote sensing data provide this opportunity.
The map above was created using Landsat 8 data. We calculated the mean NDVI value for each district of Moscow.
You can observe the usual pattern when the area & quality of healthy vegetation increases close to the suburbs. However, there are areas with dense and health vegetation not far from the city center. This map gives some insights using objective data, i.e. physical measurements.
Archives
- February 2022 (1)
- May 2015 (1)
- April 2015 (1)
- February 2015 (8)
- January 2015 (4)
- November 2014 (5)
- October 2014 (4)
- May 2014 (4)
Tags
- Air pollution (1)
- Air pollution risk (1)
- AMSR-E (2)
- Aura Satellite (1)
- CFSR (3)
- Cloud top pressure (1)
- Cloud top temperature (1)
- Greeness fraction (1)
- Hurricane Katrina (5)
- IBTrACS (1)
- isolines (4)
- LAI (1)
- MERRA (1)
- MODIS (2)
- Nitrogen dioxide (2)
- OMI (2)
- QuikSCAT (2)
- RWikience (1)
- SSMIs (2)
- Time series (2)
- TMI (2)
- Wind speed (2)


